What is YOY?
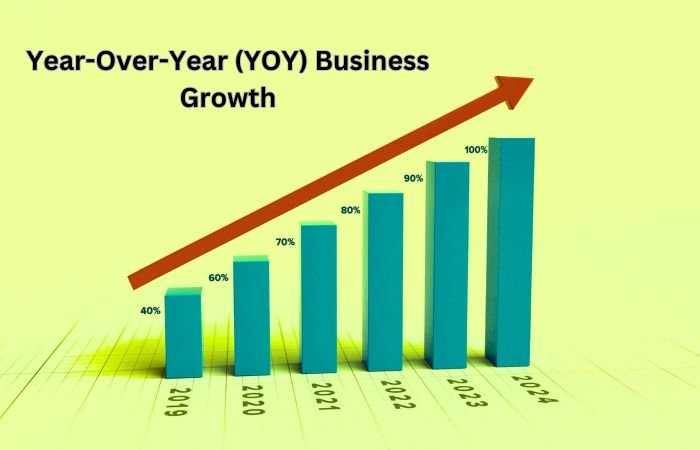
Hello Friends, The “YOY” means “Year Over Year” and is applied in finance to check the performance or financial point from one year to the same point in the prior year. YOY comparisons are important for checking growth patterns, identifying trends, and checking performance. Main applications of YOY include analyzing revenue growth, profitability, evaluating sales performance, and assessing economic indicators such as GDP growth and inflation rates.
YOY Meaning:
A technique for comparing data from one year to the prior is called year-over-year (YOY). This comparison aids in recognizing patterns, expansion, and shifts across time.
YOY (Year-over-Year) Usages:
• Finance
• Economics
• Business analysis
Examples of YOY Usages:
• Revenue Growth
• Profitability
• Sales Performance
• Economic Indicators
Understand Year-Over-Year (YOY) Performance:
A year-over-year analysis compares a company’s current financial performance to that of the same period last year. This is considered more informative than a monthly comparison, which often reflects seasonal trends.
Year-over-year, comparisons of monthly, quarterly, and annual performance are common.
What is the Use of YOY?
Comparing a company’s performance year over year is widely used to address seasonal fluctuations that can affect most businesses. Various financial metrics such as sales and profits can change throughout the year due to peak and low-demand seasons for most lines of business. Furthermore, this method differs from sequential comparison, which measures growth from one quarter or month to the previous one. For instance, it may display how many smartphones a tech business sold in the fourth quarter as opposed to the third, or how many airline seats were booked in January as opposed to December.
YOY is utilized to contrast one specific time frame with a corresponding one from the previous year. This kind of comparison permits an annualized assessment, such as comparing this year’s third-quarter earnings to those of the previous year. It is widely employed to evaluate a company’s profit or revenue growth and can also be employed to depict annual alterations in an economy’s money supply, gross domestic product (GDP), and other economic indicators.
Comparison of Year-Over-Year (YOY):
Cross-comparison of data sets is facilitated by year-over-year measurements. A financial analyst or investor can rapidly determine if a company’s revenue is increasing or declining by comparing years’ worth of first-quarter revenue data using year-over-year (YOY) data.
Despite the seasonality of consumer behavior, valid comparisons can be made by comparing the same months in various years. Investment portfolios might also benefit from this year-over-year comparison. Investors enjoy looking at year-over-year performance to evaluate how the market is doing.
How to Calculate YOY Growth?
YoY calculations are straightforward and typically given in percentages. Formula used : (this year) ÷ (last year) – 1. You can then multiply this by 100 for percentage.
Importance of Year-Over-Year Growth to Small Businesses:
It takes into account the impact of seasonal changes and market fluctuations.
Small businesses calculate the year-over-year (YoY) growth rate to analyze long-term business performance, for seasonal variations or market instability beyond their control. For instance, comparing revenue from December of this year to revenue from December of the previous year removes seasonal changes and provides a more reliable measure of growth. YoY calculations provide an accurate and unbiased representation of a company’s actual financial well-being. Moreover, it allows businesses to assess and track their long-term performance for a more holistic understanding of their standing and potential areas for improvement.
YOY Data Comparison:
For data comparison, there are numerous alternate techniques and timeframes, each with a distinct function. The following are a few substitutes for YOY analysis:
Quarter-over-Quarter (QOQ):
Data from the same quarter in various years are compared using QOQ analysis. It might be helpful for firms with large seasonal variations or for evaluating short-term trends as it offers a more frequent view of changes.
Month-over-Month (MoM):
MoM analysis contrasts data from several years for the same month. It is frequently applied to short-term trends and facilitates the identification of more rapid shifts in measurements.
Compound Annual Growth Rate (CAGR):
CAGR gentle out volatility by calculating an investment’s or metric’s annual growth rate over a period of years. It offers a single growth rate that captures the general trend and is used to compare data across extended time periods.
Moving Averages:
Moving averages compute the average over a predetermined number of periods and are used to smooth out data volatility. This may make it easier to spot underlying trends.
Sequential Growth:
Sequential growth, which works with any number of months, quarters, or years, compares data from one period to the one that came right before it. It offers perceptions into transient alterations.
Year-to-Date (YTD):
Data from the beginning of the current year and the same point in the prior year are compared in a year-to-date analysis. Businesses can use it to monitor their advancement throughout the year.
Conclusion:
It is important for companies, small or big, to have a yoy calculation to check growth and have a complete analysis report for long term business understanding . For investors, businesses, and financial analysts, year-over-year (YOY) data is a suitable tool. It makes it possible to compare financial data from one moment in time to the equal period the previous year. It presents an accurate picture of performance, showing whether it is stagnant, becoming worse, or improving.
Disclaimer:
“The all above information provided only for informative purposes and is based entirely on our own research. Visit the official website to find the more details and latest updated information.”
